We're excited to share that we were once again the top Team for rentals and #3 overall producing team at The Agency in Q1! Thanks to all of you for trusting us with leasing your properties, your home purchase, and sales, and we sincerely hope you're happy with the results. And as always, we'd love to help any you may know that could use our services!
I'd like to spend some time talking about our boots on the ground experiences of late as nearly all of the real estate data discussed in the media is several months old. Why is it so delayed? Unfortunately the most important signaler of where pricing currently stands happens at the moment contracts are signed, but b/c that amount is not available until closing, which in NYC can take 1-6 months, the data relied upon by so called experts is borderline irrelevant by the time it reaches the public. But it's still relied upon by talking heads, which to many of us in the industry, is borderline insane. This information, or lack thereof, is why it's so hard to time the market, and why so many of us say "I wish I would have bought in Spring/Summer of 2020, Fall of 2023, etc etc.", and is also why it's so important to have a really active broker you trust that can relay what's actually happening on a daily basis.
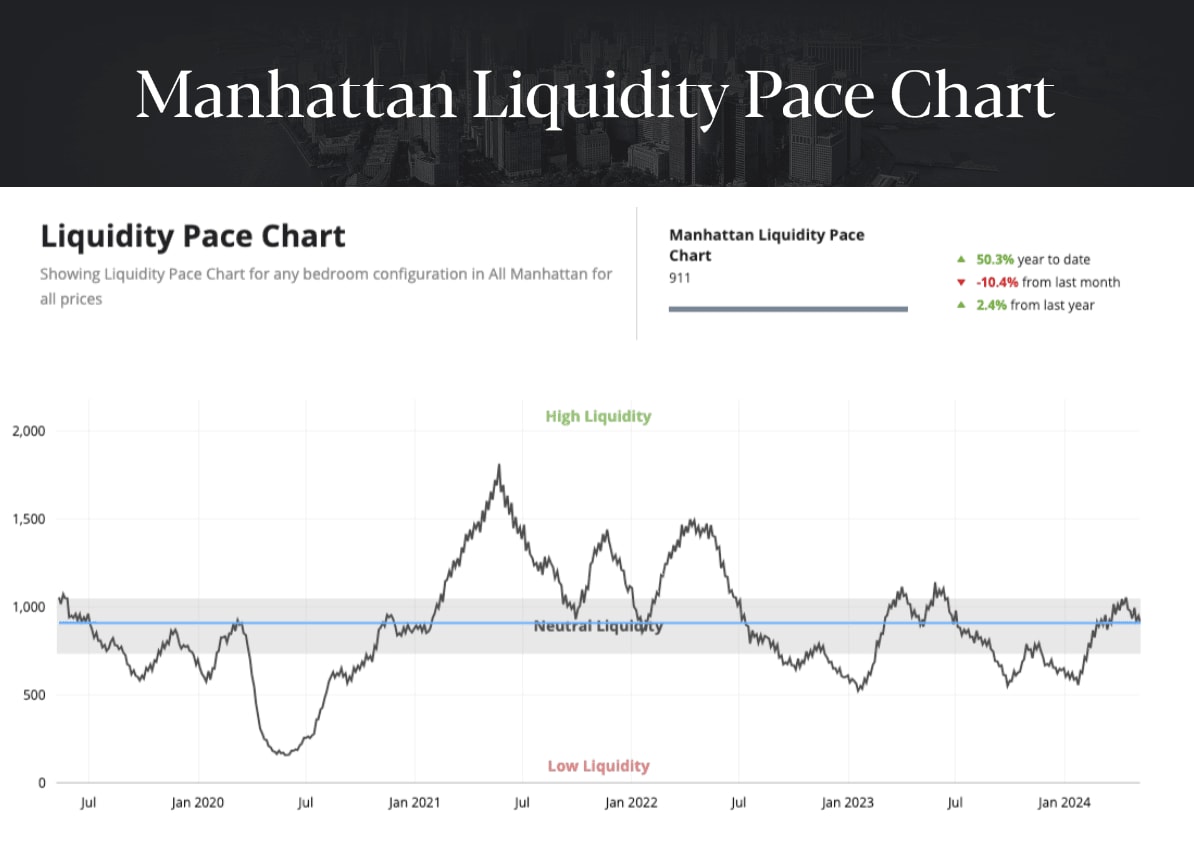
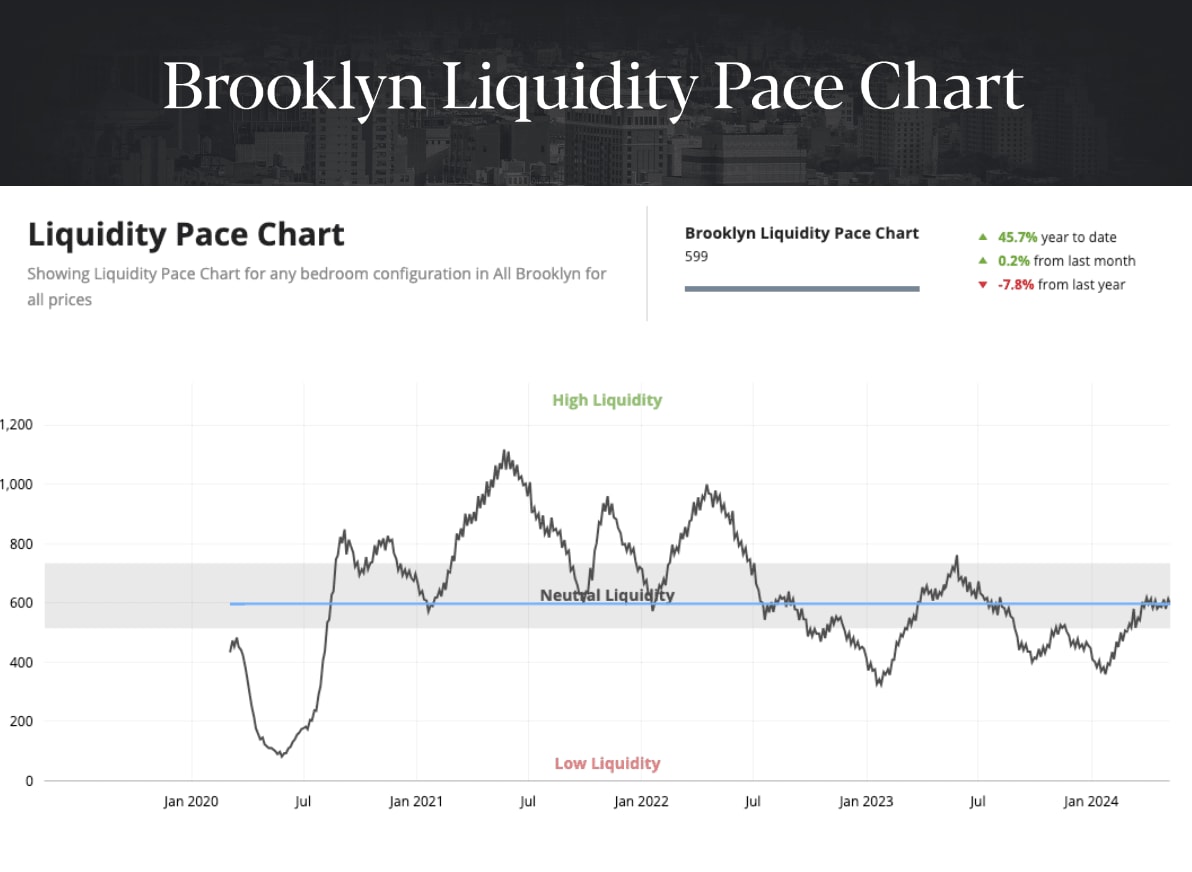
What we're currently seeing in Manhattan and Brooklyn is almost a tale of two cities (does that even make sense?!). While both are doing substantially better than last Fall (as in more contracts are being signed), Brooklyn's lack of inventory and continued desirability seemed to amp up even more over the last month. In the last three weekends I personally went to 12 open houses, 8 of which ended up having bidding wars. Nice properties are selling almost immediately where we work in the Borough, (Greenpoint to Park Slope, and East to Bushwick). But you won't find that information in any charts, including those below, because contracts take 2-4 weeks to be signed, on average. Manhattan, however, saw a nice spike of activity earlier this year but seems to be cooling. Nicer, well-priced properties are moving, but we've felt a decline of activity and showings compared to Brooklyn, and there was a whopping 38% increase in price cuts month over month, compared to just 10% in Brooklyn (which is seasonably on point).
I've included Manhattan & Brooklyn's liquidity charts below (# of contracts signed), and while these don't show pricing, they're about the best hard data we can provide regarding how the market is doing. I think we'll see Manhattan continue to tail off faster than is seasonally usual, but I wouldn't be surprised to see Brooklyn spike once more before the inevitable summer cooldown. The point is, we're often weeks or months ahead of any of the data you're going to find, so if you're thinking of buying or selling, please ask your broker how their week's been, and you might be surprised by the answer!